

If the history of science has taught us anything, it’s that we can’t trust our preconceptions about how the world works. All human societies have developed stories about their place in the cosmos. Almost without exception, these stories were wrong.
True, we’ve killed many of the old myths. But the process was slow and excruciating. Humans have existed for hundreds of thousands of years. Yet it’s only in the last 0.1% of our existence that we’ve discovered the truth (we think) about our place in the cosmos.
This revolution in our knowledge comes down to one thing: evidence. As we looked closely at the cosmos, our origin stories became increasingly tenuous. They simply could not explain the evidence. And so, with great effort, we abandoned these stories (many of us, anyway).
Why is it so difficult to abandon old myths? One reason is that these myths are used to rationalize social order. Take, as an example, the Earth’s orbit. It took the Catholic church nearly 400 years to admit that the Earth revolves around the sun. Why so long? Because the church’s power was at stake. The church tied its dogma — and hence its authority — to a geocentric view of the universe.
Faced with a challenge to its authority, the church acted predictably. After convicting the heliocentric proponent Galileo of heresy in 1633, the church banned heliocentric teachings for another two centuries (until 1822). It took another 170 years for the church to formally admit (in 1992) that Galileo was right. Think about that. Almost four centuries of denial for an idea that had no effect on daily life. All because it threatened the authority of those with power. The lesson here is simple. When ideas challenge authority, evidence will be ignored, denied and suppressed.
That brings me to economics.
The discipline of economics is the modern equivalent of the church. To legitimize authority, neoclassical economists preach dogmas that are manifestly false. But unlike the ethereal debate about the Earth’s place in the cosmos, economic dogmas have a huge impact on day-to-day life. They make the difference between tolerating inequality versus being enraged by it.
Neoclassical economics preaches that all is fair with the distribution of income. Income differences, the theory claims, stem from differences in productivity. As long as markets are competitive, people earn their ‘marginal product’. And so there’s no reason to redistribute income.
The reality is quite different. Income, I believe, is determined not by productivity, but instead largely by rank within a hierarchy. In other words, power begets income. The role of economics is to deny this uncomfortable reality. Economists reinforce hierarchies by denying their existence.
As Galileo showed, the way to combat dogma is to confront it with evidence. With that in mind, I’m going to show you evidence that challenges the neoclassical faith. Looking at the United States, I find that the single most important determinant of income is something that neoclassical economists refuse to study. It’s not education. It’s not occupation. It’s hierarchical rank.
Measuring effect size
Here’s the road ahead. I’m going to make a list of different human traits. Then I’m going to measure how strongly each trait affects income. But before we get to the evidence, we need to talk statistics. What does it mean for a trait to have a ‘large’ effect on income? Conversely, what does it mean for a trait to have a ‘small’ effect on income? How do we measure this effect size?
Here’s what statisticians have proposed. To measure effect (on income, or anything else) we compare variation between groups to variation within groups. If a trait has a large effect on income, the income differences between trait groups should dwarf the differences within groups. Conversely, if a trait has a small effect on income, the income differences within trait groups should dwarf the differences between groups.
To get an intuitive understanding for this measure of effect size, we’ll begin with something more immediate than income. Let’s step on the scale and see what affects human weight. We’ll use Americans as our guinea pigs.
A small effect
Americans tend to grow heavier with age — likely due to the obesity epidemic. But while this epidemic is devastating to human health, weight gain with age is actually quite small. Figure 1 shows the data. Here I plot the mass distribution of two groups of Americans: those ages 18–24, and those ages 65 or older. You can see that seniors are slightly heavier than young adults. But the effect is small. (You may be complaining that I’m not tracking the same cohort over time, so I can’t judge trends. Fair point. But my purpose here isn’t to rigorously study weight gain. It’s to visualize effect size.)

How do we quantify the size of this age-weight effect? To measure effect size, we compare weight differences between groups to weight differences within groups.
Let’s start with differences between groups. In Figure 1, the vertical lines show the average weight of each cohort. American seniors weigh on average 79 kg. Americans age 18–24 are slightly lighter, weighing on average at 76 kg. So seniors are about 3 kg heavier (on average) than their younger counterparts.
Now we ask — is this 3 kg difference large or small? The answer depends on variation within each cohort. Before getting to the math, think about it this way. If I was comparing the mass of two types of ant, a 3 kg difference would be huge. But if I was comparing the mass of two types of elephant, a 3 kg difference would be tiny. The difference between groups gains meaning only when compared to variation within the group.
To measure variation within groups, we’ll use the standard deviation. This measure quantifies the relative spread of the distribution. The larger the standard deviation, the greater is the variation within the group. Looking at our age cohorts, we find that the standard deviation within each group is about 19 kg. Compared to this variation within groups, our 3 kg difference between groups is small. You knew this intuitively when you looked at Figure 1 and saw that the two distributions almost completely overlapped. But now we have a metric to quantify your intuition.
A medium-sized effect
Let’s move on to a medium-sized effect. Men are, on average, heavier than women. This effect turns out to be larger than the age-weight effect. Figure 2 shows the data. American men weigh on average 90 kg. Women weigh on average 75 kg. So men are about 15 kg heavier (on average) than women.

How large is this 15 kg difference between sexes? To judge its size, we compare it to the weight variation within each sex (measured using the standard deviation). This within-group variation is about 19 kg. So our 15 kg difference between sexes amounts to almost one standard deviation. In other words, sex has a medium-sized effect on weight.
A large effect
Now let’s move on to a large effect. We’ll compare the weight of adults to the weight of newborns. Figure 3 shows the data. The average American adult weighs 82 kg. The average newborn weighs 3 kg — a difference of 79 kg.

It’s obvious, from Figure 3, that we’re dealing here with a large effect. But let’s quantify it. To do so, we compare the 79 kg difference between newborns and adults to the variation within each group. This variation, measured by the standard deviation, is about 11 kg. So the variation between groups is about 7 times greater than the variation within groups. That’s a large effect.
Comparing the signal to the noise
When we compare variation between groups to the variation within groups, we’re comparing a signal (the effect) to the noise (the non-effect). The ratio of the two is called the signal-to-noise ratio. It’s how we’ll measure effect size.
Table 1 shows the signal-to-noise ratio for how our three traits affect weight. Adult age has a weak effect on weight. Sex has a medium-sized effect. And growing from newborn to adulthood has a large effect. [1]
| Trait | Difference in average mass (kg) | Average mass variation within groups (kg) | Signal-to-noise ratio |
|---|---|---|---|
| senior vs. young adult | 2.7 | 19.3 | 0.14 |
| male vs. female | 15.5 | 19.4 | 0.80 |
| adult vs. newborn | 78.7 | 10.7 | 7.33 |
The signal-to-noise ratio in Table 1 is called Cohen’s d. It’s useful when we want to measure an effect between 2 groups. But what if we have many groups? Then we can’t take as the signal the difference between groups (it’s ill-defined for three or more groups). We need another approach.
The solution is to switch from measuring the difference between groups to measuring the variation between groups. If we use the standard deviation to measure this variation, the resulting signal-to-noise ratio is called Cohen’s f. The numerator changes (from Cohen’s d), but the interpretation remains the same. A larger signal-to-noise ratio indicates a larger effect.
When studying effect on income, however, it’s more convenient to use a slightly different signal-to-noise ratio. Income variation is usually reported using the Gini index (not the standard deviation). So it’s more convenient to construct our signal-to-noise ratio using the Gini index.
Here’s how I’ll measure effect on income. I’ll compare the Gini index between groups to the Gini index within groups:
As before, a larger signal-to-noise ratio indicates a greater effect on income. (For more details about the metric, see this paper.)
How traits affect US income
Now that you’ve had a crash course in the statistics of effect size, let’s get to the data. Figure 4 shows how various traits affect the income of Americans. The list of traits isn’t exhaustive. It’s merely the traits for which I could find data. (If you think of a trait that I missed, leave a comment.)
Let’s walk through how to interpret Figure 4. The y-axis shows the various traits. I’ve used color to classify these traits into three types: geographic, physical, and social. The x-axis shows each trait’s effect on income, measured with the signal-to-noise ratio. The boxplots indicate the variation (mostly over the last two decades) in the signal-to-noise ratio. (Here’s how to interpret a boxplot. The vertical line indicates the median of the signal-to-noise ratio. The ‘box’ shows the middle 50% of the data. And the horizontal line shows the data range. A single vertical line indicates that there’s only one data point.)

Physical traits
Now that you understand the chart, let’s walk through the results. We’ll start with physical traits — properties of the individual’s body and brain. These traits have a surprisingly weak effect on income. Take cognitive score (i.e. measured IQ). Americans love to believe that intelligence is rewarded, meaning they live in a meritocracy. Unfortunately, the evidence squashes this myth. Cognitive score, it seems, has a trivial effect on income. [2]
Interestingly, race (as categorized by the US government) also has a weak effect on income. This doesn’t mean that racism isn’t a problem. It’s just that the income difference between races is relatively small compared to the income variation within each race. (Side note: the categorization of race is obviously subjective. The way the US census has classified race has changed over time, reflecting changing politics.)
Moving up the ladder, sex has a stronger effect on income. Women tend to earn less than men. Why? There are probably three reasons. First, women are more likely to work part time. Second, women tend to work at lower-paying jobs. Third, women are generally paid less than men even when they do the same job.
Moving to the top of the ladder, the physical trait with the strongest effect on income is age. That’s easy to understand. Baby boomers, you’ve probably noticed, tend to out-earn millennials. If you believe human capital theory, this happens because people become more skilled (and hence, more productive) with age. But I’m skeptical of this idea. I think that people earn more with age largely because they get promoted in the corporate hierarchy. (We’ll come back to hierarchy in a moment.)
Geographic traits
Let’s move on to geographic traits (i.e. the place where you live). It turns out that geography affects income quite weakly. This finding is somewhat surprising, given the segregated nature of US society. There’s no doubt that the US has rich areas and poor areas. But no matter how you slice up space, the income effect of geography is comparatively small. (Sidenote: it would be interesting to see if this geographic effect was greater when segregation was an official policy, rather than an unspoken norm.)
Looking at the data, it seems that dividing the US into counties has the weakest effect on income. The divide between urban dwellers and rural dwellers is slightly larger. (People in cities tend to outearn their rural counterparts.) As we shrink the geographic area, the effect on income grows. The effect of grouping people by census tract slightly trumps the income effect of age. Shrinking the geographic area to census block groups (the size of a few city blocks) increases the income effect a bit more.
What this result tells us is that US spacial inequality is fine grain. Over large spaces (like counties), income differences are small. But as we shrink down to the city block, income differences grow. If you’ve ever walked through a city like New York, this result makes sense. The transition between a wealthy neighborhood and poor neighborhood can happen in a few hundred feet. While highly visible, this geographic effect on income is dwarfed by the effect of many social traits. So despite the segregation of US society, geography has a fairly weak effect on income.
Social traits
If humans were solitary animals, we’d expect that physical and/or geographic traits would affect income the most. (The lone wolf that’s bigger or has better territory gets more resources.) But humans are not solitary animals. We’re a social species. As such, we expect that social traits should most strongly affect income.
The US evidence confirms this expectation. The 6 traits with the largest effect on income are all social. And social traits are the only ones to cross the one-to-one threshold in our signal-to-noise indicator. In other words, they’re the only traits that have a ‘large’ effect on income.
Let’s discuss these 6 traits with the largest effect on income. We’ll start with occupation. It’s a fact of life that some jobs pay more than others. Doctors earn more than janitors. Lawyers earn more than nurses. Why this happens is matter of debate. If you’re a neoclassical economist, you’d say that lawyers have more human capital than nurses. (Interestingly, few economists have the guts to state this bluntly in the current pandemic.)
If you don’t believe the neoclassical fantasy, you’d probably say that there’s many factors at work. Better-paying jobs are often protected by guilds that maintain a barrier to entry. Poor-paying jobs are open access. Good-paying jobs are often unionized. Minimum-wage jobs are not. Some jobs are prestigious, others are not. And perhaps most importantly, some jobs (like CEO) are at the top of the corporate hierarchy. Others are at the bottom. I could go on, but you get the point. There’s probably many reasons that income varies by occupation.
Let’s move up the effect-size ladder to education. It’s worth pausing here to discuss the role of education in the neoclassical theory of income. According to human capital theory, training (of any kind) makes you more productive, and hence earn more income. The most obvious type of training is formal education. In 1958, neoclassical economist Jacob Mincer proposed that years of formal education could explain individual income. Since then, Mincer’s approach has become neoclassical gospel.
The problem (which Mincer himself discovered) is that education can’t explain income. The correlation between income and education is actually quite small. Here’s Mincer writing in 1974:
Simple correlations between earnings and years of schooling are quite weak. Moreover, in multiple regressions when variables correlated with schooling are added, the regression coefficient of schooling is very small.
Now, on its own, this low correlation between income and education isn’t fatal to human capital theory [3]. The fact is that most traits weakly affect income. This is evident in Figure 4. The income effect of most traits is well below the one-to-one level (meaning within-group variation trumps between-group variation). So yes, income is weakly correlated with education. But as long as education has the strongest effect on income, there’s no fatal blow to human capital theory.
The problem is that education doesn’t have the strongest effect on income — not even close. The income effect of education is dwarfed by the effect of hierarchical rank (discussed in detail below). So it seems that human capital theorists have hitched their train to the wrong trait.
Let’s move further up the effect-size ladder. Firm membership, I find, is the first trait to pass the one-to-one threshold in our signal-to-noise indicator. This means that income variation between firms is greater than income variation within firms. What this means is that, regardless of your position, you’ll tend to earn more at Goldman Sachs than at McDonald’s. The caveat here is that this estimate is based on a model. So treat it with appropriate uncertainty. (For details about the model, see this paper.)
Let’s move up the effect-size ladder again. Working full time versus working part time strongly affects income. This finding is easy to understand. Part-time employees work fewer hours than their full-time counterparts. And part-time wages also tend to be worse.
Moving up one more effect-size rung and we get to labor versus property income, which very strongly affects income size. You may think that this large effect happens because property owners (i.e. capitalists) tend to outearn workers. But it’s actually the reverse. The average property owner earns far less than the average worker.
What’s going on here? This result has to do with how property income is distributed. The vast majority of property owners earn almost nothing — a few dollars in interest from their savings account, and some meager dividends on their investments. For most people, this is hardly enough to survive on. That’s why they work. Sure, there are people like Bill Gates who earn all their income from property. But these people are exceedingly rare. Because most property owners earn almost nothing, labor income tends to dwarf property income.
If you’re a Marxist, this result should give you pause. Formulated in the 19th century, Marxist theory envisions a clean division between capitalists and workers. In reality, no such division exists. Most people earn a tiny bit of capitalist income. A few people earn a lot. So being a capitalist (or not) is a matter of degree. (As an aside, it turns out that this degree of being a capitalist is closely related to hierarchy. I discuss how here.)
The effect of hierarchy
We’ve finally arrived at the raison d’être of this post — the income effect of hierarchy. My hypothesis is that hierarchy is central to how humans distribute resources. The reasoning is simple. Our social relations govern how we divide the pie. And hierarchical relations are by far the most potent. The testable consequence of this hypothesis is that hierarchical rank should effect income more strongly than any other trait.
Before getting to the results, I’ll clarify what it means to group individuals by hierarchical rank. Figure 5 shows a conceptual example. Here we have different hierarchies, with distinct hierarchical ranks. To measure the income effect of hierarchical rank, we group people by rank across all hierarchies.
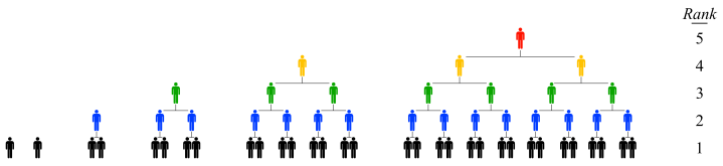
In conceptual terms, it’s easy to measure how hierarchical rank affects income. But in practical terms, it’s quite difficult. The problem is that few people have gathered the relevant data. Although ubiquitous in human societies, hierarchy has not been well studied.
To estimate how hierarchical rank affects income, I cobble together three different sources. Each source comes with caveats, and none are ideal. The data labeled ‘Mueller et al.’ (in Figure 4) comes from a study of UK firms. The data labeled ‘Heyman’ comes from a study of Swedish firms, and carries the ‘*’ because it doesn’t include all hierarchical ranks within firms. The data labeled ‘US model’ is a model-based inference, based jointly on data from firm case studies and the pay of US CEOs. (For details about the model, see this paper.)
This data on hierarchy is admittedly ragtag. But that’s part of wading into uncharted empirical territory. What’s important here are two things. First, despite their ragtag nature, the three estimates for the income effect of hierarchy are consistent with one another. Second, these estimates dwarf the effects of all other traits.
So the evidence, which is admittedly uncertain, suggests that hierarchical rank has the strongest effect on income.
And yet it moves
Upon being convicted of spreading heresy, Galileo is said to have remarked: “And yet it moves.” He was referring of course, to the Earth. Galileo had mustered the first evidence that the Earth revolves around the sun. The evidence, though, was indirect. Galileo had closely watched the motion of Venus, and found that it had phases — just like the moon. He concluded that this could happen only if Venus orbited the Sun. By extension, he inferred that the Earth also moved around the Sun.
The Church thought differently. Of the heliocentric model, the church inquisitors concluded:
… this proposition is foolish and absurd in philosophy, and formally heretical since it explicitly contradicts in many places the sense of Holy Scripture …
New evidence, unfortunately, is often greeted with this reaction — especially by people with a lot (of power) to lose. While my research pales in comparison to Galileo’s, it’s been greeted with similar resistance. ‘Formally heretical’ … ‘contradicts scripture’. This is essentially the reaction to Figure 4 that I’ve received from neoclassical economists.
Now, I’m the first to admit that the evidence is uncertain. Moreover, this evidence doesn’t establish causation. It doesn’t tell us that hierarchical rank causes income. Still, the evidence suggests that something is deeply wrong with the neoclassical understanding of income. It suggests that treating hierarchical rank as the strongest determinant of income is a hypothesis worth exploring.
Neoclassical economists will have none of this. The idea that hierarchical rank most strongly affects income, I’ve been told, is ‘foolish and absurd’. Why? Because it explicitly contradicts neoclassical scripture. Income, scripture says, must stem from productivity. So behind hierarchical rank, there must lurk some unmeasured skill. Silly me — I’m naive enough to take my results at face value, just as Galileo did when interpreting the phases of Venus.
The case for hierarchy’s effect on income is tentative, yes. But if we accept dogma, we’ll never know the truth. The task for hard-nosed scientists is to gather more evidence and see what happens. Either the case will grow stronger with more evidence, or it will disappear. Join me in this search.
Notes
[1] Whether we call an effect ‘large’ or ‘small’ is arbitrary. It depends on the type of phenomena we’re studying. In psychology (where effect sizes are generally small), the common thresholds for Cohen’s d are: small effect = under 0.2, medium effect = between 0.2 and 0.8, large effect = over 0.8. When it comes to income, my preference is that we shouldn’t call an effect ‘large’ unless the variation between groups is larger than the variation within groups. This threshold corresponds to a signal-to-noise ratio larger than 1.
[2] Is cognitive score a ‘physical’ trait? I use the term ‘physical’ here not in a genetic determinist sense, but in the sense of ‘residing in the person’s body’. Every property of the brain, whether inborn or learned, is a ‘physical’ trait because it’s a property of the matter inside the person. (OK, this isn’t true if you believe in mind-body dualism.) There’s no doubt that practice can improve your performance on IQ tests, in the same way that exercise can improve your athletic performance. But both types of performance still reside in the body.
[3] There are many other blows to human capital theory that are fatal. Most importantly, the theory posits that productivity explains income. But economists never measure productivity independently of income. Instead, all of their evidence for productivity is, in fact, circularly tied to income. For details, see these posts:
- No, Productivity Does Not Explain Income
- Productivity Does Not Explain Wages
- Debunking the ‘Productivity-Pay Gap’
- Productivity and Income … Again
Further reading
Fix, B. (2019). Personal income and hierarchical power. Journal of Economic Issues, 53(4), 928–945. Preprint at SocArXiv
Wright, E. O. (1979). Class structure and income determination (Vol. 2). New York: Academic Press. (Wright was, as far as I know, the first person to explicitly study the income effect of hierarchical rank.)
Support this blog
Economics from the Top Down is where I share my ideas for how to create a better economics. If you liked this post, consider becoming a patron. You’ll help me continue my research, and continue to share it with readers like you.

Stay updated
Sign up to get email updates from this blog.

This work is licensed under a Creative Commons Attribution 4.0 License. You can use/share it anyway you want, provided you attribute it to me (Blair Fix) and link to Economics from the Top Down.
Hi Blair,
As you know I am very interested in the cooperative model, which I propose does not have have the effect of hierarchy on income that you have identified. However, unfortunately, maybe the lack of hierarchy in cooperativism also explains its low relative importance in economic life, biological or culture factors mean people prefer to be told what to do, so they seek positions within stable hierarchies.
The need to question economic orthodoxies is there (I am getting interested in the degrowth movement at the moment), but at the same time it seems in some countries the Neoclassical economic orthodoxies aren’t nearly so dominant, in particular the Scandinavian countries.
Of relevance to your work is the claim that more people achieve the ‘American Dream’ of social mobility, (starting off poor and ending up rich) in the Nordic countries than anywhere else [1]. It would be interesting to look at the same statistics as you have in Denmark, Norway, Finland. The hierarchy effect might still be strong but the spread of incomes not nearly so great. Or maybe there are other ways to ‘get ahead’ other than seeking power. I guess looking in more detail to explain these effects is now your aim.
[1] https://www.weforum.org/reports/global-social-mobility-index-2020-why-economies-benefit-from-fixing-inequality)
Hi Steve,
Interesting points. Something that is not well studied is whether Nordic countries are less hierarchical than other Western countries, versus if they just do a better job of limiting the excesses of hierarchies. If the former were true, we’d expect Nordic countries to either have smaller institutions, or for these institutions to have flatter hierarchies. I’m not sure if either is the case.
My hunch is that these countries just do a better job of limiting the returns to hierarchical rank. As you point out, this greater equality is associated with more upward mobility. Now here’s the interesting question. Is this class mobility a result of limiting the returns to hierarchy? Or does class mobility itself limit the returns to hierarchy? I don’t know of anyone who has studied this. But it’s definitely worth looking into. Alas, so much is yet unknown.
Thought provoking, but I think there may be a flaw, because of inequality. What would happen if you took the analysis and did it the other way round? If you took a dollar and asked which grouping was it most likely to belong to? If you take fairly equal sized groups of people and look for dollars, you will never see much difference because the average of the majority will mask the exceptions.
Hi Michael,
Your comment, as I understand it, points out something important. There’s a difference between measuring the effect on income versus measuring the effect on inequality. I discuss this difference in Appendix H in Personal Income and Hierarchical Power.
Let’s start with measuring effect on income. This is essentially about the ability to use a given trait to predict someone’s income. The more accurately we can do this, the greater is the trait’s effect on income. Importantly, the number of people with each trait doesn’t matter. Low-ranking workers far outnumber CEOs. But this doesn’t matter if we want to measure the effect that being a CEO has on individual income.
When we switch to measuring the effect on inequality, however, the size of each group does matter. Measures of inequality weight income against the number of people with said income. So when we measure the effect on inequality, it matters that low-ranking workers far outnumber CEOs. How much it matters depends on the measure of inequality we use.
In Hierarchy and the Power-Law Income Distribution Tail, I find that the effects of hierarchy are important mostly in the tail of the distribution of income. Removing hierarchy entirely (in a counterfactual model) doesn’t much change the Gini index. But it hugely changes the income share of the top 1%.
So to answer your question, there’s an important distinction between measuring the effect on income vs. measuring the effect on inequality. In this post (and the associated paper), I focus only on the former.
PS I liked your idea of Economics as Theology rather than Science. As a cell biologist (retired) I see the subject much the same way.
I would love to interest you in a simple question. In the crash of 2008 and in the COVID crisis, where did the money disappear to? Did it just vanish into thin air?
I think of the economy as a central heating system, and money as the water circulating round it. Classical economists seem to claim that it is a logical impossibility for radiators to leak. If you put more water in the system it will burst. MMT is better, but seems to claim that money is created out of fairy dust in the boiler, and when it returns to the boiler the key process is that it is turned back into fairy dust. I would love to persuade you that it is the leaks in the system (or how money disappears into thin air) that need to be understood.
If printing money in response to a crisis is just replacing money that has gone for ever, then it is common sense, not wild irresponsibility.
Hi Michael,
I side with MMT on this. Money is an accounting ritual, nothing but numbers on an accounting ledger. It can be created and destroyed at will. Probably the best study of the history of money is David Graeber’s Debt: The first 5000 years.
Blair, Thank you so much for responding. Agreed, MMT is a fact, not a theory. But the question I think gets missed is “where is the money?”. With coronavirus, where is the money that would have paid the wages of laid-off workers? Where are the earnings of companies closed by lockdown? And is the absence of money today different from the absence in 2008? or 2000? or 1974? (PS I hope your critics on hierarchy have read The Peter Principle.)
[…] Trait Affects Income the Most?” [Economics from the Top Down] (see also). “Income, I believe, is determined not by productivity, but instead largely by […]
[…] Which variables are most correlated with income? (Does not entirely make sense, but has some significant points and correlations of […]
[…] Which variables are most correlated with income? (Does not entirely make sense, but has some significant points and correlations of […]
This is great material. I hope you’re familiar with Thorstein Veblen. I think his “Theory of the Leisure Class” is another way of explaining income distributed according to position and status in a hierarchy.
Hi Anthony,
Yes, I’m admire the work of Veblen. His work has strongly influenced my thinking.
Two issues.
First, the “hierarchical” variables and “firm” variables are fundamentally different from the others. They are essentially “outcomes” that lots of other variables have contributed to (some included here, many omitted). They are not “traits.” So I don’t think those variables tell us anything useful, and definitely don’t upset the economic wisdom the author seems to be fighting against. (Good luck!) Of course people with higher job titles get paid more than people with lower job titles! Of course people at top firms get paid more than people at mediocre firms! Again, these are not traits. How do people get into these firms and positions within the hierarchy? Talent, productivity, network connections, luck. Lots of unobserved stuff.
Second, the between/within measure of effect size is interesting. But I interpret results differently. Most everything that is an “input” (“trait”) rather than “output” (see above) is below 1. (Exception is labor/capital, which author explains well.) This implies that there is more variation within groups than between groups. We have observed this for a long time. Lots of variation within groups! We put people in groups in order to study them (mostly to study variation) and find aggregate patterns in data, but individuals are never completely reducible to their observable characteristics. It means that we are missing lots of unobserved stuff that contributes to this variation (ie omitted variables). Many, perhaps most, are difficult or impossible to measure. A quandary for those of us who measure and analyze for a living!
Hi SZ,
You write:
Here’s the problem with your argument. You could say the same thing about any social trait. Take education, the darling of human capital theory. Educational attainment is an outcome of many other complex factors (family life, intelligence, race, etc). Yet this fact doesn’t stop economists from measuring the income effect on education. And rightly so.
You can’t decide a priori what constitutes an ‘input’ to income and what constitutes an ‘outcome’. If you do, you’re free to discard any results that you don’t like … as you seem to be doing here.
You write that hierarchical rank ‘is not a trait’. You’re falling into the fallacy of methodological individualism, in which an explanation for income (or any other social outcome) must reside in properties of individuals. You’re correct that hierarchical rank isn’t an individual trait. It’s a social trait — a characteristic that one person has in relation to other people.
You’re correct that ‘individual’ traits poorly explain income. But that’s expected! We’re a social species. It’s our relations that matter.
The whole analysis is extremely strange. Safe to say, I don’t think economists are going to be too impressed by Fix’s confident assertion that “Unfortunately, the evidence squashes this myth. Cognitive score, it seems, has a trivial effect on income. [2]”, given that the only thing he seems to base this on is his weirdo within-firm analysis yielding ecological fallacies (and also Fix doesn’t seem to do anything to correct for issues like measurement error which we know greatly deflates correlations like SES or income). I think everyone else will stick with the much larger conventional estimates computed on individual level rather than ‘firm hierarchical’ levels…
Robomo,
Read the methods before you criticize them. The measure of effect size for cognitive score has nothing to do with variation within firms, nor the effect size of any other trait. Every measurement is separate.
I have no idea what you’re talking about. You’ll have to clarify if you want me to respond.
I read the source paper and found it very interesting. One thing I was curious about was if there was anything in the data showing a comparison of effect size between raw power and hierarchical power? E.g. a plant manager has the same hierarchical level as a finance director, but much more “power” as defined in your model (say ~200 total subordinates in one plant vs 40 in the finance division). Or alternatively as a measuring stick on “flatter” firms with wider spans and less layers (more average direct reports vs total subordinates). Just wondering how this works out in the overall model, whether you could do a simple “bin” methodology on power vs the hierarchical approach taken.
Hi BK,
There is still very little research about hierarchy. As far as I’m aware, no one has done this type of fine-grain research. It’s definitely worth pursuing though. But I can tell you that the lowest paid US CEOs tend to work in highly regulated sectors. See this paper: https://www.brookings.edu/bpea-articles/regulatory-constraints-on-ceo-compensation/
I found a similar result when I analyzed the data. See Figure 15 in this paper: https://osf.io/preprints/socarxiv/pb475/
As far as how this relates to the ‘flatness’ of hierarchies, no one knows.
I went back to my uni textbook “Economics of Australian Labour Markets” by Norris et al (2005) and I quickly found a page on hierarchical remuneration and tournament models as a driver for increased pay as a worker goes up the ranks in the hierarchy. I’m surprised there isn’t a more extensive literature given the appearance in a basic labor economics textbook from 15 years ago. Shrug.
Very well done article. Few thoughts.
1. My wife is the breadwinner in income and even she took 5 months off to tend to our first child and 4 months with our 2nd. I think taking time out of potential promotion cycles and how that relates to heirarchy is an interesting consideration on that point.
2. Property income:. Does that account for depreciation? We make a lot of cash income but report negative income. If depreciation is factored into this it will skew that statistic.
Hi Ben,
About property income, that’s a good question. I take the data as reported by the US census. This data is based on self reported surveys. I’m not sure if it includes depreciation. My guess is that it doesn’t, since depreciation is more of a tax statistic.
while an interesting line of questioning there’s 2 issues with this article:
the first is that companies promote their most able workers(ideally), so being in a high hierarchy position could just mean your a great worker who should get paid a lot. (you worked for less than you should while an underling and when your quality was recognized with a promotion they paid you appropriately).
Secondly, the statistical method of comparing within- to out- group means is that it falls prey to Simpson’s paradox; if the people high up in the hierarchy are full time, well educated, city living, white males then you dont know if the hierarchy variable is adding any information or just segments the people who would and wouldn’t earn a lot anyway.
The second issue could be solved with a regression, if you had the underlying data and not just estimates of effect size; but I don’t know how you’d distinguish between the CEO being the best worker, for whatever position, and being paid the most becuase of it.
Even comparing the pay of people who got promoted to those that didnt when they were on the same level has this issue.
Hi Clark,
About ability and rank, see my response to Dave C. About your criticism of my method, you’re correct that it’s possible for the effect of other traits to ‘add up’ to the effect of hierarchy. You can tease this out with regression, which I do in this paper: http://www.paecon.net/PAEReview/issue86/Fix86.pdf
I find that education and firm experience cannot explain the returns to hierarchical rank. In fact, returns to education and experience virtually disappear when you account for returns to rank.
On a more philosophical note, appealing to ‘hidden ability’ is good way to make your theory unfalsifiable. There’s no way to prove that hierarchical rank isn’t a result of some (unmeasured) skill. But that’s a bad way to do science. (But a good way to do ideology.)
Hi Blair (see bottom for what I think is root of our disagreement),
when you give someone a promote and raise you’re saying: “Due to the quality of this individual at their current job we expect them to perform the best at this next job, and we’re going to start paying them at the quality of their work at this next job, which since they’re managing more people means that they have a much broader impact”. I think you should take this at face value: ask anyone who’s had a bad boss, or note that the day Steve Ballmer announced his departure from Microsoft the stock was up 8%($20 Billion), or see “CAPITALISTS IN THE TWENTY-FIRST CENTURY” by (Smith, Yagan, Zida, Zwick, 2019) where after company owner/operator’s retire or die profit falls by >75%, all of which show the impact you can have while managing people[*1].
It’s a much larger assumption that executive’s decide promotions by pulling names out of hats rather than who they think would do best(‘unmeasured skill’). Just because you can’t measure it doesn’t mean it doesn’t exist, and I wish I could think of a way to settle this[*2]. Either way the prior probability is that people whose job it is to decide promotions/raises aren’t incompetent; people get paid somewhat close to the value they contribute, and estimates of that value aren’t biased by the number of reports that person has.
[*1]at a certain level in the hierarchy you also start making decisions about how the business will operate.
[*2]You could just send out a bunch of resume’s with “Jill/Jane was head of the Finance department for ZYX Corp., which has 50/200 employees” and see who gets a higher offer, because reading through the comments, would you agree that your main argument is `managing more people inflates your perceived value`?
Another thing,
Summarizing your response to Dave as “while the CEO is more productive than a mailman, when the CEO worked in the mailroom he got paid as a mailman, so someone isn’t getting his marginal product”, I think make’s clear the issue of time, in that more productive mailmen don’t get rewarded just with more money today, they get rewarded with more money in the future plus responsibility(that people like promotions over just raises is what gives rise to the peter principle).
I wonder if another reason for our difference is that I think there’s basically 1 attribute (call it ‘ability’, but it could be a mixture of a bunch of traits which when added together give you this) that would make you successful at most positions in a company, while you think there’s distinct requirements for each stage of advancement? For example, I’m familiar with Banking where the Best Analysts make the best Associates which make the best VP’s which (generally) make the best Director’s, and while there’s some different required skills at each stage, this is generally true, it’s a combination of ‘desire to do a great job + contentiousness/willpower + charisma + detail oriented + … ‘ and so you’ll pick of things on the job to do whatever it takes, but the set of people who can be an Analyst is a strict superset of the people who are high enough on ‘ability’ to be Director?[*3]
Do you have in mind that for ranks X, Y, Z in a hierarchy those people need to be best at the unrelated skills A, B, C and so X is done by Mr. Best_A, and Z is done by Ms. Best_C and since they probably wouldn’t be good at the other tasks there’s no reason for the person performing X vs. Z to get paid differently?
[*3] it doesn’t require a strictly hierarchy of ability, just that there’s many more humans who are good at skill A vs. skill C relative to X vs. Z roles, and since being good at role Z bring in more revenue than X, both XYZ Co. and ZYX Co. bid up the salaries of the minority who can do Z well.
Convince me of either `managing more people inflates your perceived value` or [*3] and I’ll agree with you; till then my prior is things are mostly done the way people say they’re done and have an incentive to do.
I’m willing to grant you that rank may correlate with some measure of ability. But here’s the problem. The distribution of human abilities is roughly constant in all human societies. So why, then, do hunter-gatherers almost completely lack inequality. And why do feudal societies have immense inequality? The difference has nothing to do with the distribution of ability. It has to do with the growth of hierarchy. Yes, I’m sure that companies believe that they promote people based on merit. But so what? Feudal societies thought that birth right was meritorious. What’s important is the social structure that surrounds this reward of ‘merit’ (or lack thereof). Without hierarchy, I believe that massive inequality is impossible.
Clark,
The task for an ability theory of income is to show how human abilities — which are known to be very equally distributed whenever we measure them — could possibly give rise to income inequalities as huge as the ones we observe. Why do we never measure a distribution of IQ with a Gini index of 0.6, as found with US income? No matter how you measure it, human ability is just not that unequally distributed. No one has ever mustered evidence showing otherwise. That’s why ability theories of income were abandoned a century ago.
I think that rank in hierarchy is mostly determined by merit. This is especially true in groups that work well together. Groups that work well together are likely to succeed in competitive environments.
I worked in a semiconductor fab. When we had a problem to solve, I was happy when the people who understood the problem best did most of the talking. Meetings have leaders. Some people are good at running meetings. In a good organization, these people will be promoted up the hierarchy. Meetings consume the time of multiple people, so it is worth a lot of money to run the meetings efficiently and get the informed people to share their data and theories.
My hypothesis is that companies that promote the people who are best at helping groups work together efficiently will out-compete companies that promote people who run meetings poorly.
This ability to help groups get get good work done by using power wisely is a very valuable skill. The people who do this best are paid a lot of money because their organizations earn a lot of money.
Hi Dave,
I’m not discounting that merit may play a role in determining hierarchical rank. But it need not. In feudal societies, for instance, rank was inherited. It’s hard to argue that inherited status has anything to do with merit.
Suppose, though, that rank is rewarded to those who merit it. Does this mean that merit, and not rank, is what determines pay? No. To make this argument, you’d have to show that the same ‘meritorious’ people would earn the same amount even if they were at the bottom of the hierarchy, not the top. And, I think you’ll agree, they wouldn’t.
We’re dealing here with two separate causes. Cause 1 is how income is assigned to each rank. Cause 2 is how people are assigned to each rank. Saying that cause 2 stems from merit (which may or may not be true) says nothing about cause 1.
Why would anyone think they’d have the same productivity at opposite ends of the hierarchy, where they’d have very different responsibilities? If you were running a company, you could have people with less skills at the bottom of your hierarchy. The amount by which productivity can vary for an individual there is limited. But at the top a bad hire can be disastrous and a good one can save the company.
None of this says anything about what’s “fair”. But economists rarely discuss “fairness”, instead focusing on “efficiency”. If a company was picking names out of a hat (which no economist would think was the case), but nevertheless found the “efficiency wage” at the top was highest (if they had to be compensated with stock to incentivize them properly, for instance), that’s that. If there’s an inefficiency, so that these could be done more productively or at lower cost, that would be of interest.
Economists talk endlessly about productivity. The problem is that they have no way of measuring it independent of income. Similarly, the word ‘efficiency’, as used by economists, is meaningless. It’s supposed to measure output per unit of input. But economists cannot measure either objectively. Please tell me an objective way to determine if a wage is ‘efficient’.
Individual income and productivity actually can be distinguished. For example, I am a programmer, and it is well known that productivity varies much more than income within firms (implying that firms are averse to paying people differently if they have the same job title). Some jobs pay for performance with things like commissions. There is a problem in that a firm doesn’t want to give bad incentives at the firm level by encouraging employees to boost their out output at the expense of their peers (like a chicken farmer selecting the largest chickens who peck their peers to death). The relevant thing is the profit of the firm as a whole, so you’ll want to know the “marginal revenue” or “marginal product” of the employees. The findings people mentioned about the stock price changing with a change in CEO is evidence of the marginal effect of those CEOs.
Profit is not ‘productivity’, it’s income. If you measure productivity in terms of profit, everything becomes circular. Income begets income. You’ve explained nothing.
Thank you for posting interesting data. Higher ranking people definitely earn more money.
Some people resent the size of the difference in income. They resent it more if they think rank is arbitrary.
Your data show that rank is strongly correlated with income. But everyone already knew that CEOs make a lot of money.
If people move up in organizations by merit, then society is fair. But if they move up due to family connections or threats of violence or bribery then society is unfair because good people are shut off from opportunity.
You write a blog. You try to write good articles because you know that good articles will get links on sites like Marginal Revolution. You know that high ranking people with power will read your good articles and scorn your bad articles. You know that you might receive an attractive job offer based on someone’s opinion of just one good blog post. You behave as if the people in your country will reward merit. And this is a good thing because now I get to read more good blog posts.
A thousand years ago, people could move up the hierarchy by helping their king win battles. Now people move up the hierarchy by writing good blog posts, by solving manufacturing process problems, by helping their teams succeed at work. It seems to me that the world is working like it is supposed to, and much better than it did a thousand years ago.
Of course some things can still be improved, and many ambitious people are working to improve them.
1. I don’t care if sites like Marginal Revolution link to my blog
2. I don’t care if people with power read my blog.
3. You’re conflating position within a hierarchy and income. Just because you ‘deserve’ your rank doesn’t mean you ‘deserve’ your income. How come US generals are paid about 10 times the bottom-ranked soldier? But CEOs are paid 100 times bottom-ranked employees?
4. Why does social mobility (i.e. meritocracy) decline when inequality increases?
5. Of course things are likely better today than in feudal societies. So what? It doesn’t mean they can’t get better still. Imagine a world in which CEOs made littler more than a teacher. I’d like to live in that world.
No, it’s not circular, and if you don’t understand that it really brings your competence to tackle this issue into question. Others have discussed how Microsoft’s stock went up when Ballmer left. Let’s discuss the marginal change from Ballmer to Satya Nadella. How much more money did Microsoft make with the latter vs the former? That’s a different question from how much money Nadella personally made. The company and the CEO have different marginal revenues. The point of compensating a CEO with stock though is to incentivize them in alignment with the company as a whole. Since the CEO doesn’t own 100% of the stock in a publicly traded company, he doesn’t receive all of the revenue (and even a sole proprietor doesn’t necessarily treat his company’s revenue as his own personal income).
In marginal productivity theory, as originally formulated, productivity is explicitly defined in physical terms, as a quantity of commodities. That’s good, because these quantities are independent of income. But to derive the theory John Bates Clark was forced to assume a single-commodity world. That’s the only way the theory is logically consistent — the only way you can compare the productivity of different workers.
In the real world, there are many commodities. That means you can never compare the marginal productivity of different workers. The solution, for economists, is to turn to revenue (i.e. sales). They use sales as a measure of productivity. That’s a big mistake. Sales are a type of income. They mix prices and quantities. So it’s not surprise that one form of income (sales) correlate with another form of income (wages).
This relation says nothing about productivity. It’s totally circular. I’ve written about this many times, so please read about it before you comment further:
https://economicsfromthetopdown.com/2019/07/08/no-productivity-does-not-explain-income/
https://economicsfromthetopdown.com/2019/11/14/productivity-does-not-explain-wages/
The bottom line is that, in science, you can’t test a theory using a variable that is circularly dependent on what you’re trying to explain.
How does the cognitive score comparison work? It’s not black vs white, male vs female, rural vs urban
It’s a spectrum, so the effect size would depend on how you make the comparison as you demonstrated with age & weight.
Young Adult vs. Senior is a small effect size on weight while Infant vs Adult is a large effect size on weight.
Is it a similar case for Cognitive Score?
To calculate effect size on a continuous variable (like cognitive score) you have to group people into bins. I go through this in the methods appendix. Yes, how you group people will slightly affect the measure of effect size. But it can’t turn a small effect into a large effect. The correlation between income and IQ is trivially small.
I was under the impression that social scientists did regressions on continuous variables all the time without binning.
Yes, but to do a multivariate regression on many traits, you need a single dataset containing info for all of the traits. No such unified dataset exists for all the traits studied here. Hence the need for a different method. It’s based on analysis of variance, which is widely used in the social sciences.
In organizations I have worked for, “hierarchical rank”, usually called level, *is* your pay grade, Senior technical/professional staff who supervise no one are generally paid more than and outrank line managers of skilled/unskilled roles, because they add more value. But I’m not surprised that pay grade is a good predictor of income.
How do you know that they add more value, other than that they are paid more?
You could try starting a company and setting lower pay for positions that you think add less value, with higher pay for positions you think add more value. Although that wouldn’t mean deviating from srengr’s observation about the relationship between rank and pay, just having a different relationship for job descriptions and rank compared to other companies.
This is a dumb article imho. Sure, people who achieve high rank get more money, but why do they receive the money, and is rank handed out at random? Could it be that high-ranking people have exceptionally big noses, that provoke submissive impulses in the people around them? Could it be that big business is like a competitive sport (let’s say chess), where a grandmaster is 100x more likely than a non-grandmaster to defeat a grandmaster opponent? If running General Motors is analogous to playing chess against Toyota for billions of dollars per game, GM’s best strategy is to hire the best grandmaster they can, and pay her many millions. None of this addressed by the article. Rather than chess or cognitive ability you should look at personality characteristics, that bring people into leadership. Also the income may not come from directing lots of people, but rather, being in authority to decide the disposition of large amounts of money (so of course they direct as much as they can to themselves). Anyway, you might like the book “A Natural History of the Rich” by Richard Conniff.
As with many of the comments, you are insisting that the only ‘true’ explanation for income is one that attributes it to properties of individuals. That’s a fallacy — a sad reminder of the grip that methodological individualism has on economics. There is a fundamental problem with attributing income to ability. The distribution of income changes over time and space. The distribution of ability, by and large, does not.
Another simple flaw in your argument. GM’s best strategy is to hire a good strategist, yes. But if they want to increase profit, they should pay their employees (CEO or otherwise) as little as possible. That’s surely what they do with bottom-ranked employees. So why doesn’t the same principle hold with CEOs? Surely because CEOs have power, and those at the bottom don’t.
why do you assume the returns to ability are constant over time? Why do you assume that there’s as many individuals qualified to be a CEO, relative to available spots, as there are for the bottom ranked employees? (You do agree that a good vs bad CEO has a much larger impact on revenue than bottom ranked employees?)
I am insisting that returns to ability are not constant over time. That means ability cannot explain income.
Hi Blair,
Sorry for the poor wording, but if for an example we’re defining ability as ‘the factors, not under an individuals control(eg. genetics + environment) which cause them to be good at programming computers’, then we both agree that the returns to this ability have drastically increased in the past 50 years and that this ability still could explain a large portion of current income (or height and Basketball playing, now that NBA pay has taken off). Would you also agree that email has made top down communication more efficient, so the best communicators could do their jobs better? That larger companies can benefit more from clear communication? So yes, while I agree with you that over the past millennium, most changes in income have nothing to do with ability, and that social structure can determine pay, I think you’re unnecessarily signalling out “structure -> pay because exploitation” as opposed to “structure -> pay because changes in how $ can be exchanged for work”.
Again If you have some prior for why more powerful people are paid better beyond performing more valuable work please share it; you still haven’t given evidence to distinguish between ‘hierarchies are used to enrich themselves’ and ‘those higher in hierarchies have a higher MLP’.
Clark,
Your thesis is unfalsifiable. It is impossible to show that high-ranked people aren’t more productive than low ranked people. That’s not a strength. It means your hypothesis is useless. Marginal productivity is unmeasurable, and therefore not worth talking about.
Look how you are framing everything circular terms:
You’re saying that valuable work begets income. Totally circular. Show me a measurement of productivity that isn’t circularly dependent on income. Show me a measure of ‘ability’ (independent of income) that affects income more strongly than hierarchical rank. Show me the evidence.
Why do you assume GM is not, in fact, paying its CEO as little as possible?
Spend some time with the mechanics of corporate life and you’ll realize very quickly that managing up to a million people or a trillion dollars in capital is not a task for which you simply select the lowest bidder.
And yet the same task, fifty years ago, was done for a pittance of what modern CEOs make. Go figure.
what was per capita GDP 50 years ago? where did all that extra wealth come from? what is the Pareto optimal distribution of CEO income?
incentives for owners tend to be a function of market cap, which is a function of expected future cash flows
again, spend some time in the corporate world and you’ll very quickly learn how hilarious the idea is that anything about a C-level job in a Fortune 1000 company is “the same job as 50 years ago”
but okay maybe CEOs are overpaid these days, and maybe LeBron James’ ability to put a basketball in a hoop isn’t actually worth a billion dollars, but who gets to decide that?
cash flows follow market outcomes, which are arguably too contingent to be correlated to ability, but remember market decisions are ultimately rendered by consumers and all utility is in the eye of the beholder
now suppose we only paid of the best NBA basketball players 2-3x median income… in some sense it doesn’t matter at all, as almost exactly the same number of baskets would be made, etc, but in another sense it matters a great deal because the level of play would be much inferior as the best athletes pursued other opportunities and thus the games would have low utility for fans of basketball
CEO pay is much the same, the practical difference being the level of NBA play has far fewer real-world consequences for society than CEO “level of play” which tends to drive wealth creation and rising living standards
It might also help if you define ‘ability’ with regards to the examples I gave in [*3]. (just search for that text string above), and actual ability vs. perception of ability.
I’ve given previous examples of productivity:
“ask anyone who’s had a bad boss, or note that the day Steve Ballmer announced his departure from Microsoft the stock was up 8%($20 Billion), or see “CAPITALISTS IN THE TWENTY-FIRST CENTURY” by (Smith, Yagan, Zida, Zwick, 2019) where after company owner/operator’s retire or die profit falls by >75%, all of which show the impact you can have while managing people”.
Company stock prices are independent measures of ability, or see how much performance(profit, sign-ups, morale, etc.; any corporate measure) declines due to an unexpected death, when someone less vetted is placed in.
I feel you having a ‘drunk looking for his key’s under the light, when he lost them in the dark’ issue where just because it might be hard to measure, you think it doesn’t exist.
P.S. Reward’s aren’t going to be Linear in ability; eg. Nobel prize winners have IQ’s of >150, but regular professors have IQ’s of ~130, and prize winners are >>150/130 times as successful. You have to critique that the opportunities for a given level of ability don’t match what’s observed.
Thanks, the data up to the “hierarchical rank” was interesting.
Rest seems a bit circular.
[…] How various traits affect income. [Source] […]
Blair, thanks again for the stimulating and provocative post.
I am concerned, however, with your surprisingly naive interpretation of Marx.
Yes, Marxist theory does rely on a “division between capitalists and workers”. However, it is patently wrong that “being a capitalist (or not) is a matter of degree”. Owning a tiny bit of capitalist income definitely does not turn you into a tiny capitalist. When discussing how much income is necessary to make someone a capitalist, Marx explicitly resorts to Hegel’s notion that quantitative differences bring about qualitative differences after they reach a tipping point. Thus,
“The minimum sum of value the individual possessor of money or commodities must command in order to metamorphose himself into a capitalist changes with the different stages of development of capitalist production, and is at given stages different in different spheres of production, according to their special technical conditions.” (Capital, Vol. I, Ch. 11)
As a first (rough) approximation, we can say that you are a worker if you need to sell your labor power in the market to keep your living standards, while you are a capitalist if you do not. Keeping to that definition, I now raise a challenge: find a moderately reliable proxy for the binary social trait “worker/capitalist”, introduce it in your graph, and let’s see what happens. I am pretty sure that the income effect of hierarchical rank will be dwarfed by the effect of the new social trait. Which means that you will have the chance to hitch your train to the right trait.
For us Marxists, it makes perfect sense that – apart from social class – hierarchical rank should have the strongest effect on income. After all, capital “is essentially the command over unpaid labour.” Like medieval landlords and slaveowners before them, present-day capitalists extract from wage-workers more labor than these workers would need to reproduce their current life standards. And as in any system of labor exploitation that ever existed, capitalist control over surplus-labor is implemented through a chain of command, including a predictable system of increasing rewards for workers as their rank in the hierarchy increases.
I understand that where you come from taking Marxist theory seriously is treated as a capital sin. You need to constantly evoke a straw-man if you want to be heard by academic peers so deeply immersed into capitalist apologetics in the guise of science. But I urge you to do the effort. You will find that Marxist theory is not only entirely congenial, but accommodates much more easily your own assumptions and results. You are almost there anyway!
Hi Marcos,
Thanks for the comments. I am more sympathetic to Marx than you might imagine. But as I see it, Marx had two sides. On the one side was Marx the social critic, who I largely agree with. On the other side, was Marx the scientist, who I think went down the wrong track. In my academic training, there was absolutely no hostility to Marx. Quite the opposite. Many of my grad school peers worshipped Marx.
About the binary between works/capitalists. What you could do is adopt an (arbitrary) threshold in capitalist income beyond which everyone is a capitalist, and below which you are a ‘worker’. So say we define people who earn 80% of their income from property as capitalists. Below that value you’re a worker. Yes, I agree that this distinction would strongly affect income, although I don’t know of good data to test it.
It’s something I’ve have on my to do list for the future.
[…] What Trait Affects Income the Most? […]
[…] is one. My own investigation of how income relates to hierarchical rank is another. (Read about it here). The truth, though, is that these theories are flies on the human-capital elephant. As Figure 6 […]
[…] What Trait Affects Income the Most? […]